I LOVE finding out about different ways to appreciate the Sun and light in general. Use this forum to post your info or questions about various outside the mainstream ways to appreciate our life giving star!
Hi all after Stu kindly shared his spreadsheet templates i have been playing in Excel 2016. I wanted to see if i could manipulate the data to show a level bar graph to act as a sort of indicator with colour changes at certain levels.
The bar chart now takes the incoming data every half hour and subtracts the max and min levels in that period. It won't be exactly the same as other magnetometers a there is no North South data but not bad. This is work in progress and needs refined. As there was quite a bit of activity last night i thought i would share. Data from 10:02 21/04/17 until this morning.
Here is the plot from Lancaster and it looks very similar, not sure if it is the same data analysis but it show 2 peaks but it does included lasts nights hit as well. I'm not sure which hours yours corresponds with (no hrs on X axis).
Thanks Alexandra here is a plot for the same period you posted. I think the lack of N S data to add makes a difference. It does pick up the larger changes however. Bit more playing and tweaking required. Working in Excel is a steep learning curve.
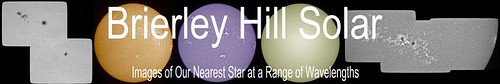
H-alpha, WL and Ca II K imaging kit for various image scales.
Fluxgate Magnetometers (1s and 150s Cadence).
Radio meteor detector.
More images at http://www.flickr.com/photos/solarcarbon60/
http://brierleyhillsolar.blogspot.co.uk/ Solar images, a collection of all the most up to date live solar data on the web, imaging & processing tutorials - please take a look!