Hi Christian.
In answer to your questions:
>>>As we go from -0.55A to +0.55A, could we say we have about 0.09 A shift between two successive images ?
Yes, the change in wavelength between frames is 0.092A.
>>>It seems to me that the three images close to the centre line are very similar. In other words, beeing +or - 0.09A from the center line gives the same result ?
Yes, in my experience this is generally true. An exception might be if there is a feature with large radial velocity in which case the appearance of the feature might look significantly different on the long wavelength vs short wavelength side of line centre.
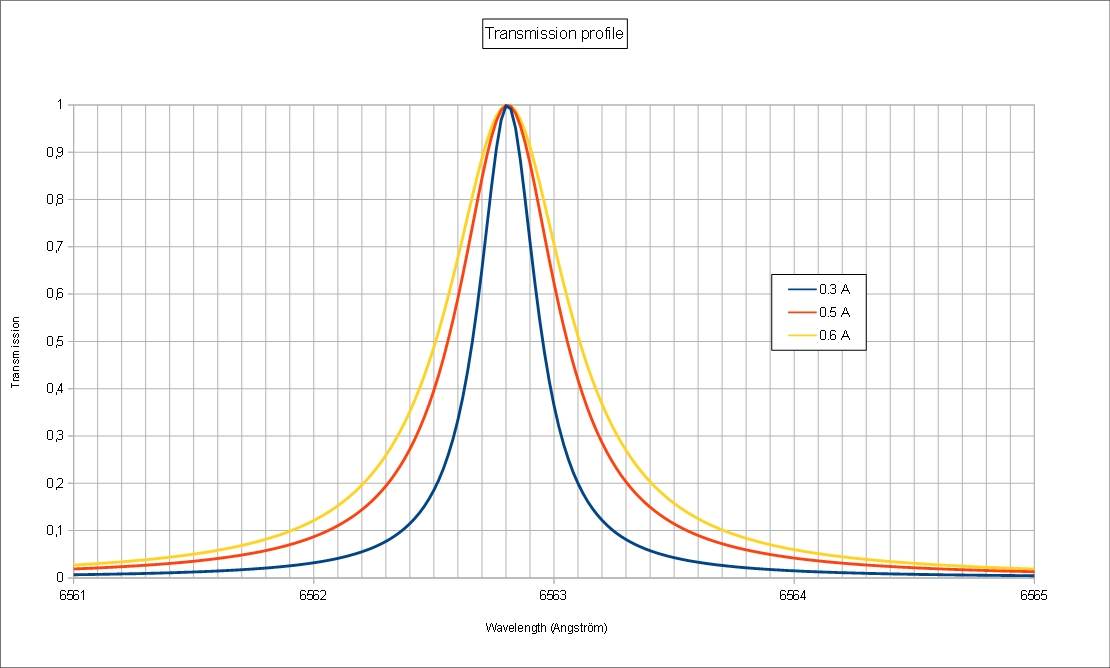
>>>Do you have an idea of the transmission profile of the spectroheliograph ? Fabry-Perot etalon have a Lorentzian profile, what about spectro helio ?
The spectroheliograph lineshape is that of a grating spectrometer with slit-width limited resolution. The mathematical shape of such a line is determined by the entrance slit width, the associated angular spread arising from the diffraction pattern of this slit introduced by the collimator optics, the convolution of this spread function with the ideal grating function (sin^2(N*delta)/sin^2(delta)) and another convolution with the diffraction pattern from the camera optics! A wide slit produces a corresponding wide spectral line and, as the slit width is decreased, the spectral linewidth also shrinks until diffraction effects begin to dominate.
There is a discussion of the lineshape function in "Spectrophysics" by Thorne, Litzen and Johansson (Springer 1999) Chapter 12. They show that the lineshape evolves from a flat-topped function at large slit width to a smoother, peaked function for smaller slits. They describe an optimum slit size condition in which the image slit width (equal to physical slit width for collimator focal length equal to camera focal length) matches the diffraction limited width of the camera optics. These authors show a number of calculated lineshapes for various slit widths and, for narrower widths, the function certainly appears to resemble Gaussian (their figure 12.2).
Eversberg and Vollman ("Spectroscopic Instrumentation" Springer 2015) demonstrate that the sequence of convolutions required to mathematically determine the lineshape function can ultimately reduce to a Gaussian lineshape (although this argument depends on some fairly significant approximations).
Being somewhat unhappy about the detail required to mathematically determine a lineshape and not quite convinced about the approximations introduced by Eversberg and Vollman, I decided to perform a simple measurement of lineshapes for various slit widths (notwithstanding the statement of Ken Harrison and the nice picture of Spectral Joe).
The setup is pictured. The SHG telescope was removed and a Hg discharge tube was placed in front of the slit holder. I imaged the Hg yellow doublet (5769.598A, 5790.663A), captured in a single frame of the video camera, to provide a convenient wavelength calibration and do a lineshape study on the stronger component (5790.663A) of the doublet.

- SHG front end siz2.png (427.92 KiB) Viewed 7024 times
Here are the results for slit widths of 100 microns (line fwhm ~ 0.7 A), 25 microns (line fwhm = 0.21 A) and 10 microns (line fwhm = 0.14 A).
Black squares are measured data and red curves represent curves of best fit.

- 101137 Hg feature profile 100um slit siz.png (41.69 KiB) Viewed 7014 times

- 094532 Hg feature profile 25um slit siz.png (36.69 KiB) Viewed 7014 times

- 094408 Hg feature profile 10um slit siz.png (36.3 KiB) Viewed 7014 times
You can see the flat-topped lineshape at 100 microns (obviously not a Gaussian profile!) reduces to smoother functions at 10 and 25 microns which seem to be well-described by Gaussians. I was planning to include a 50 micron slit measurement but discovered that the bayonet holder was badly machined and didn't fit into my instrument. In any case, I would say that my observations are completely in line with the theory of Thorne et al. Also, it appears that, for a small enough slit width, the lineshape is Gaussian.
Best Regards.
Peter.