Hi Carl,
Setting up sampling rate:
The first task is to set (or check) the sampling rate.
Under SpectrumLab OPTIONS select 'spectrum display settings' and then under the 'spectrum (1) tab ensure that the sampling rate is set to 150 seconds. This provides sufficient resolution for daily data capture.
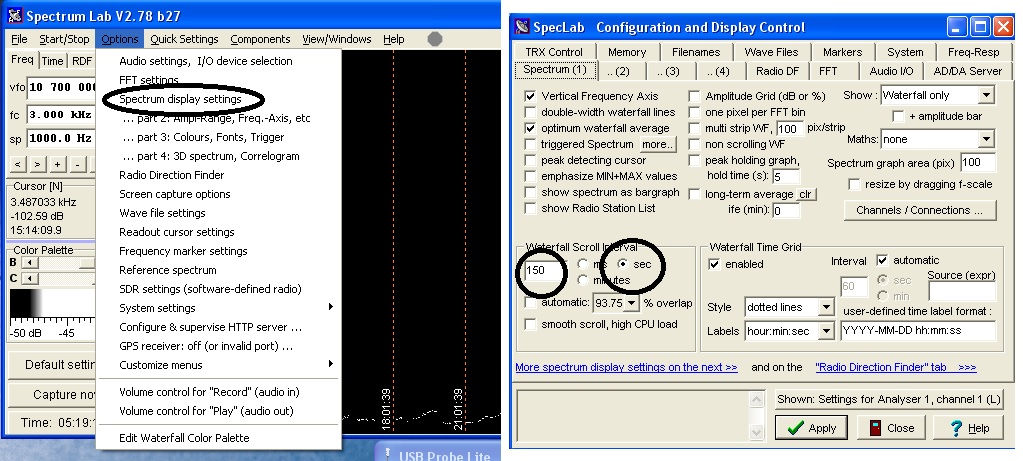
- Setting sampling rate.jpg (214.07 KiB) Viewed 4801 times
Setting up data capture:
Back on the main screen, select FILE and tick 'Export Calculated Data (Continuously)'.
Under the File Contents tab ensure that the column separator value is set to '9' and that the number of columns is set to '2'
Set the column titles as shown (time and frequency) and set the values and format as shown.
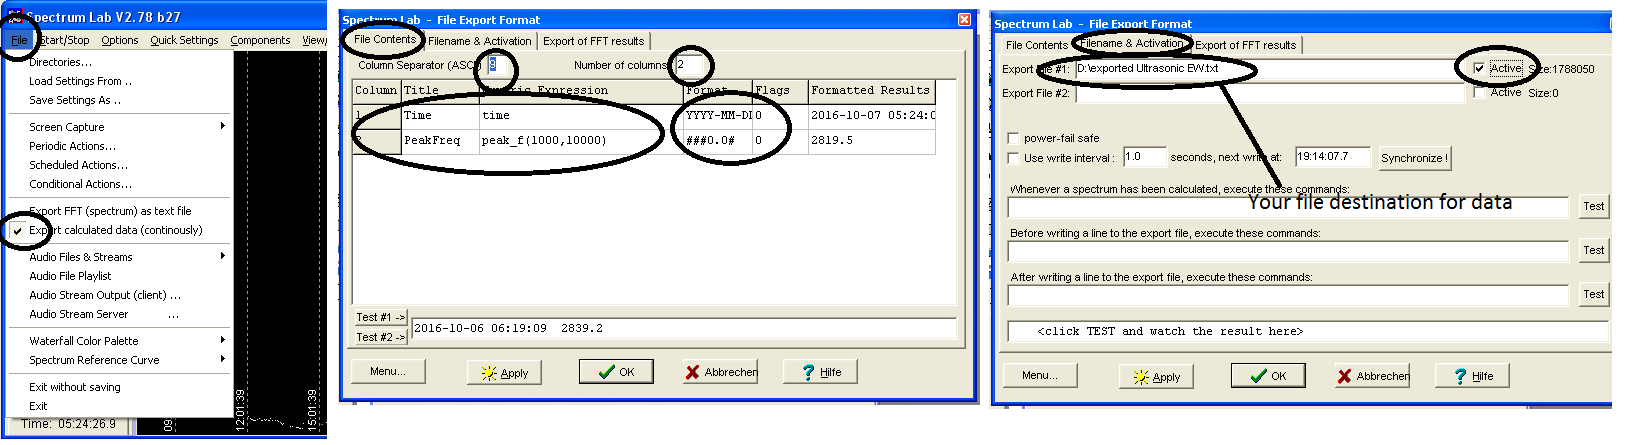
- Setting exported data format.png (47.13 KiB) Viewed 4801 times
Under the file activation tab set the destination folder to which the data will be saved and tick 'active'. Data will then be captured at the rate set above (150 seconds) and saved in the designated folder.
CSV data:
Your captured data should open as a CSV text file, similar in format to this.....
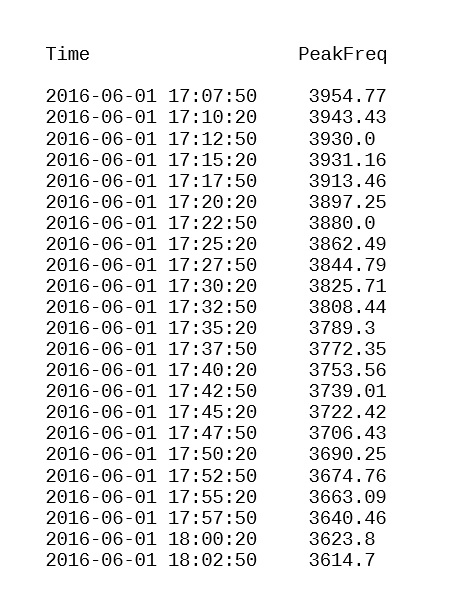
- CSV file.jpg (117.11 KiB) Viewed 4801 times
You can then simply highlight the values (not the headings), copy and paste into cell 'A8' of the Excel spread sheet. The entire column should then automatically populate with the data and the spreadsheet will generate the output data. Don't forget to set cells F3 and F4 with the 'null' frequency (the frequency at which the output from the detector drops to zero) and the 'set frequency' (the frequency set on the detector LCD screen to give an output pitch of 3-4 kHz). Keep cell H4 (filter) set at 8 for now. This can be changed to higher or lower values to modify the output depending on the quality of the input (i.e. noise spikes). Higher numbers here have less of a filtering effect on the data.
Cells K3 and K4 allow you to scale the charts according to your closest 'INTERMAGNET' station if you want to. Simply go online to
http://www.intermagnet.org/data-donnee/dataplot-eng.php, select a station closest to your location and plot the relevant data. Take note of the max and min nT values and use these to set cells K4 and K3 accordingly.
The following screen shots just tell you about setting up the charts, which you might already be familiar with.
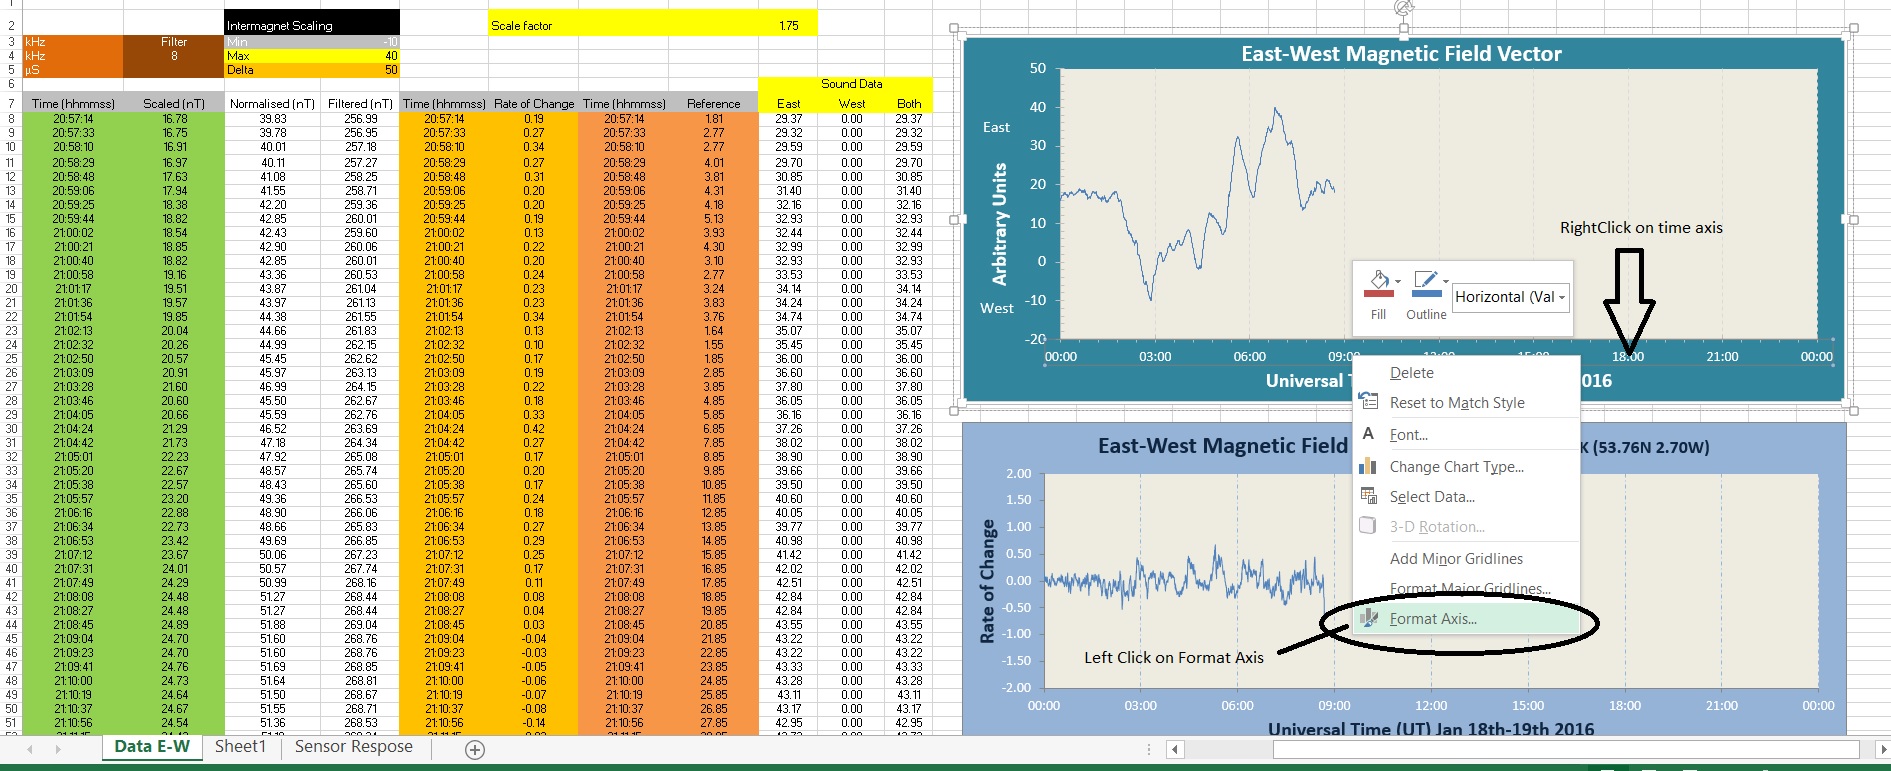
- Chart1.jpg (491.66 KiB) Viewed 4801 times
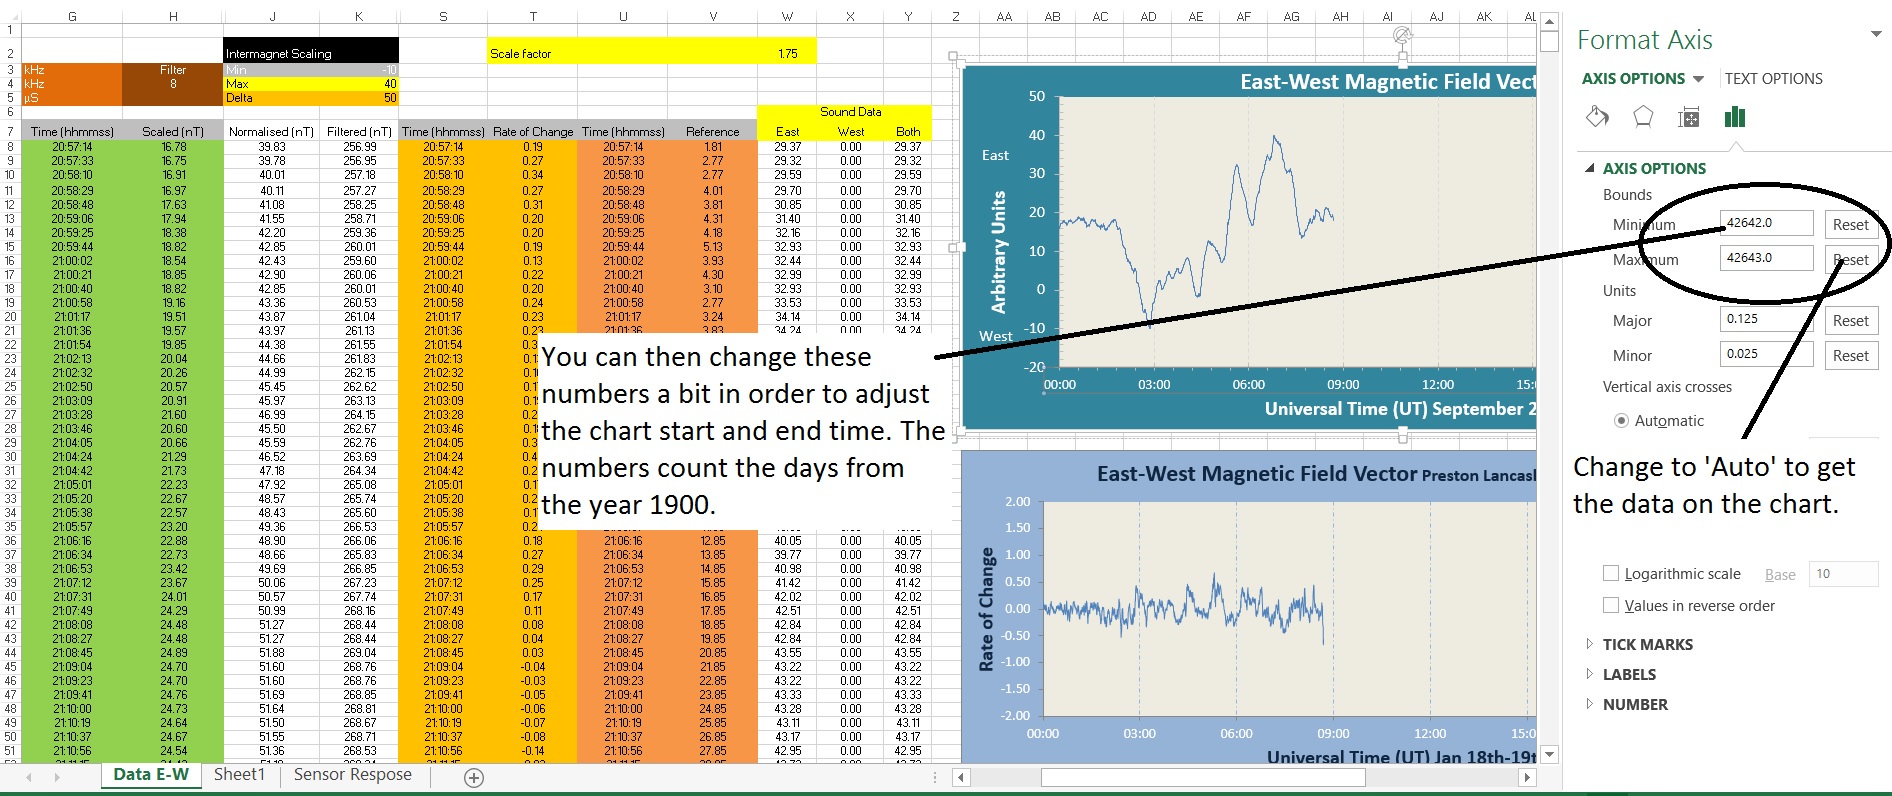
- Chart2.jpg (508.66 KiB) Viewed 4801 times
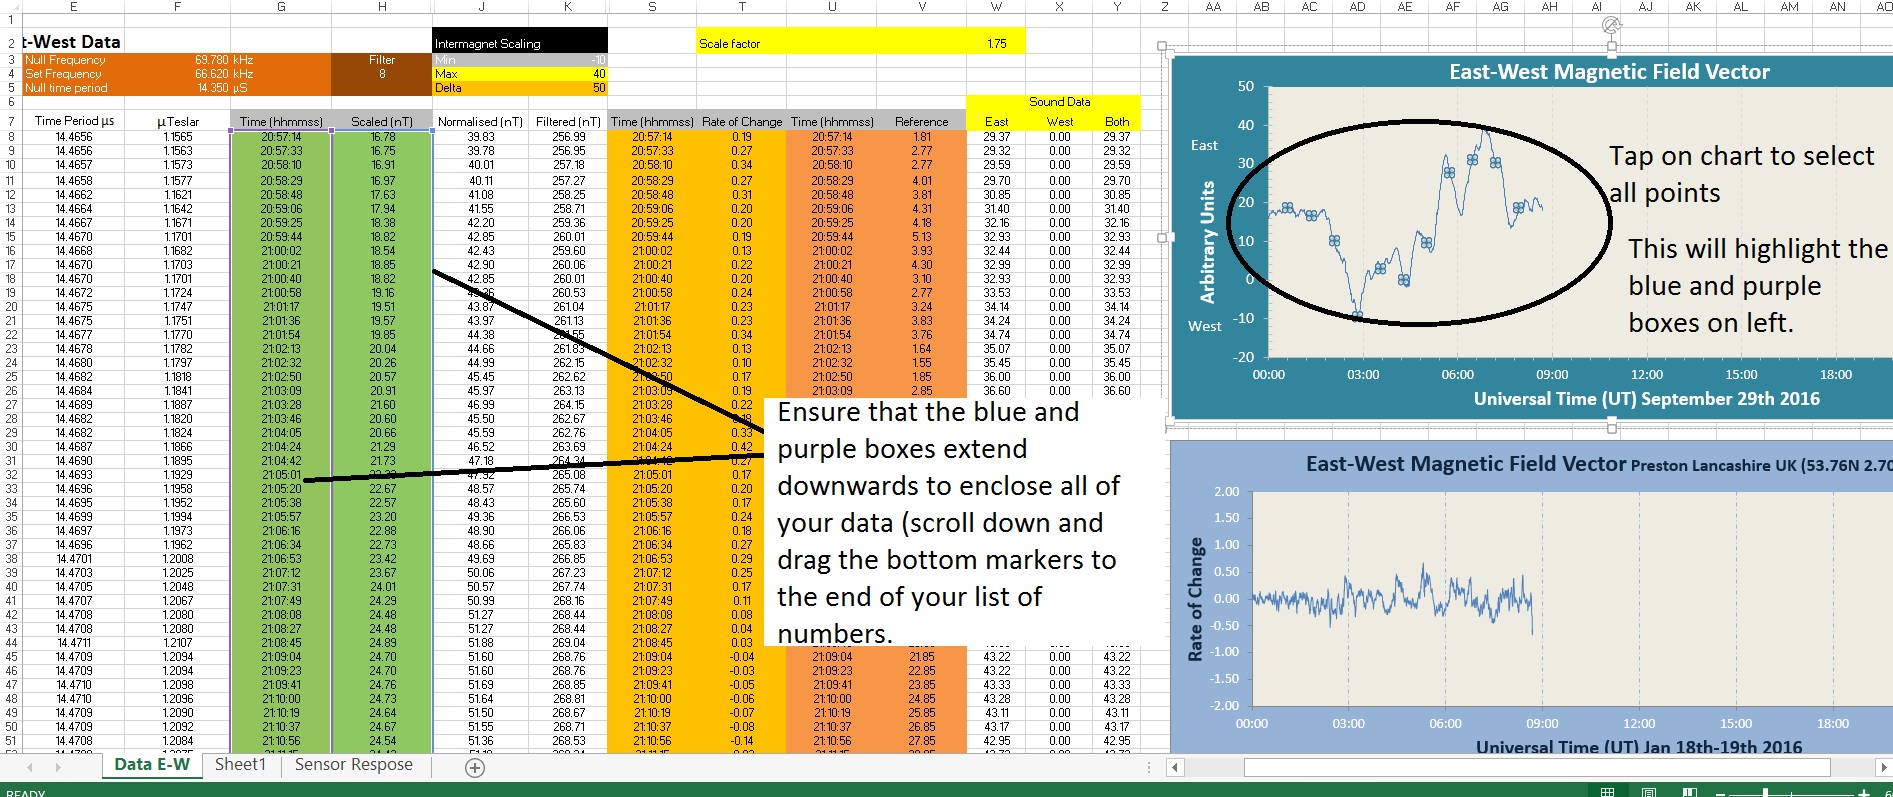
- Chart3.jpg (563.99 KiB) Viewed 4801 times
I hope this helps.
Stu.